
All datasets have a fundamental geometry or shape. These structures are often complicated and difficult to visualize. To make imaging these datasets easier, a team of researchers from Dartmouth has created HyperTools. HyperTools is an open-source software package that uses mathematical techniques to gain information about high-dimensional datasets by looking at the geometric structures.
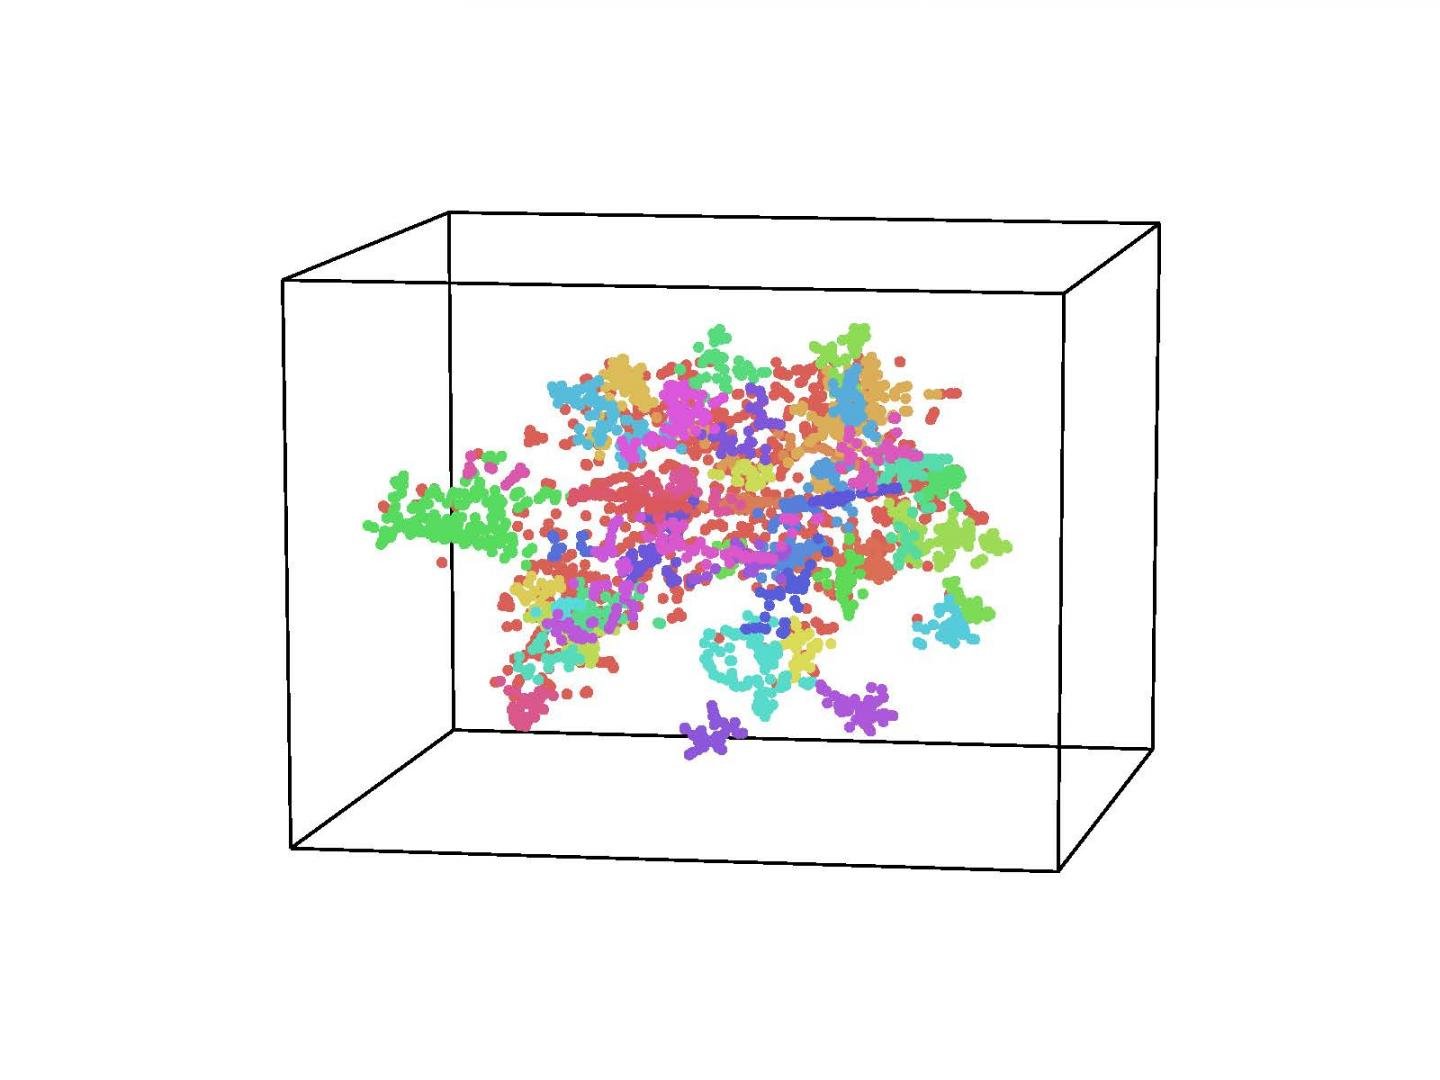 This is a visualization using HyperTools to represent the content of Wikipedia articles. Each dot represents a single Wikipedia article (from a set of 3,000 randomly chosen articles). (Source: Static image by Contextual Dynamics Laboratory, Dartmouth College)
HyperTools transforms data into visualizable shapes or animations. These shapes can be used to compare datasets, gain insights into underlying patterns, make generalizations about datasets and develop test theories relating to Big Data.
"The datasets we're faced with as modern scientists can be enormously complex, often reflecting many interacting components," explained senior author, Jeremy R. Manning, an assistant professor of psychological and brain sciences and director of the Contextual Dynamics Lab at Dartmouth. "Our tool turns complex data into intuitive 3-D shapes that can be visually examined and compared. Essentially, we are leveraging the visual system's amazing ability to find patterns in the world around us to also find patterns in complex scientific data."
The team has demonstrated HyperTools in the new paper that was published in April 2018. HyperTools makes visualizations of brain activity, how the brain responds to movies, changes in temperature on Earth from 1975-2013 and even how the political tweets of the 2016 U.S. presidential campaign affected brain activity. The data gathered by HyperTools could also be used to guide the development of machine learning algorithms.
The lab is continuing to develop and release other types of geometric visualization analyses.
The paper on this research was published in the Journal of Machine Learning Research.
