Sponsored content
Testing a vehicle’s electronic control unit (ECU) involves recording a large amount of data and analyzing that data to detect anomalies and problems.
Current Methods for ECU Testing
Testing often requires connecting different equipment to collect data. Data acquisition equipment, storage oscilloscopes, control area network (CAN) bus equipment, video cameras, spectrum analyzers and frequency counters may all be used to collect various types of analog and digital data. Once data is recorded by the respective equipment, it is then placed on a computer.
To make this data useful for analysis, the timing of each recording device must be aligned. Aligning data becomes difficult because each device may not have a time stamp or is accessed with different software. To use many of these datasets together, they must be pulled into a spreadsheet for matching.
Benefits
Using a mixed equipment setup has its benefits. It allows testers to use common, off-the-shelf equipment they may already own. Equipment like action cameras and GPS devices are inexpensive and easy to find. Additionally, those operating the test equipment are likely already familiar with its operation.
Drawbacks
This method of data collection also has some deficiencies that need to be considered. The main issue that users will face is assembling and making sense of the data once it’s collected. Data recording rates differ: for example, an oscilloscope may record a voltage reading ten times a second while a multimeter might record every half second, resulting in misaligned data. Even if this data is lined up, coordinating it with video or other information is difficult.
With this mixed-data approach, accuracy is difficult to determine. Devices with time stamps may still be inaccurate because the stamp may drift between devices. Devices without time stamps cause even more problems: lining up data becomes a guessing game, and finding specific data points becomes nearly
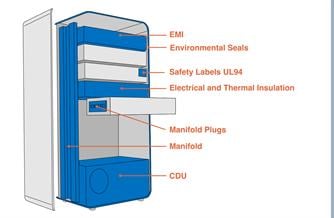
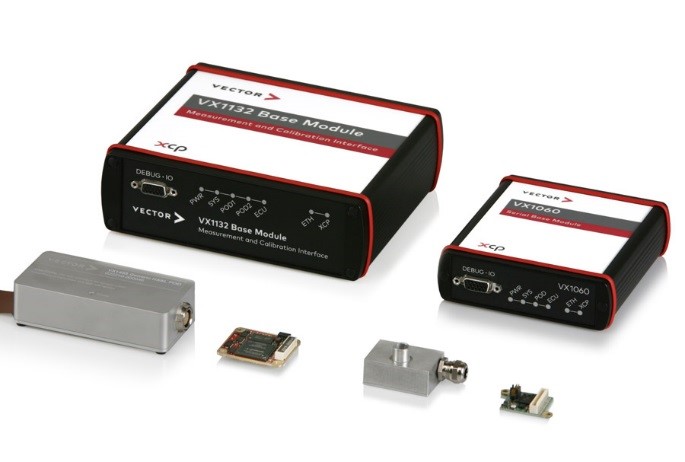 Figure 1: Testing an ECU involves recording a large amount of data and analyzing that data to detect anomalies and problems. Source: Vector
impossible.
An Integrated Solution is Better
An integrated method that uses various modules and software that work together with a common time stamp is better, allowing the data to be stored and organized in one spot with a common file format. The data is time-stamped so that every piece is lined up as it is recorded. Results are easy to view and are coordinated during the test. Having the data stored this way means it is easy to spot issues and see when they are solved. This makes analyzing data easy, ensuring quick and intuitive understanding of the information.
ATC-A Use Case
![]()
Take the case of Aisin Technical Center of America Inc. (ATC-A), a company tasked with testing the ECU for a sunroof. Prior to using the Vector system, ATC-A attempted to build their own system for testing and analysis of the ECU data. Their original method included tools such as an oscilloscope and data acquisition system. When additional current readings were needed, a multimeter was used, and the readings were manually read and entered. ATC-A also developed a switch box of its own design.
Collected data was entered into a spreadsheet to recreate the waveforms and various data points. The process of assembling the data was manual, but was also assisted by programming macros. Once compiled, the data was reviewed to determine which adjustments and calibrations the ECU needed. The prescribed adjustments were then flashed to the ECU and the process was repeated. In some tests, additional data points were needed and the test was run again to get them. This was an intensive process, so ATC-A sought a better way.
Vector Equipment and Software
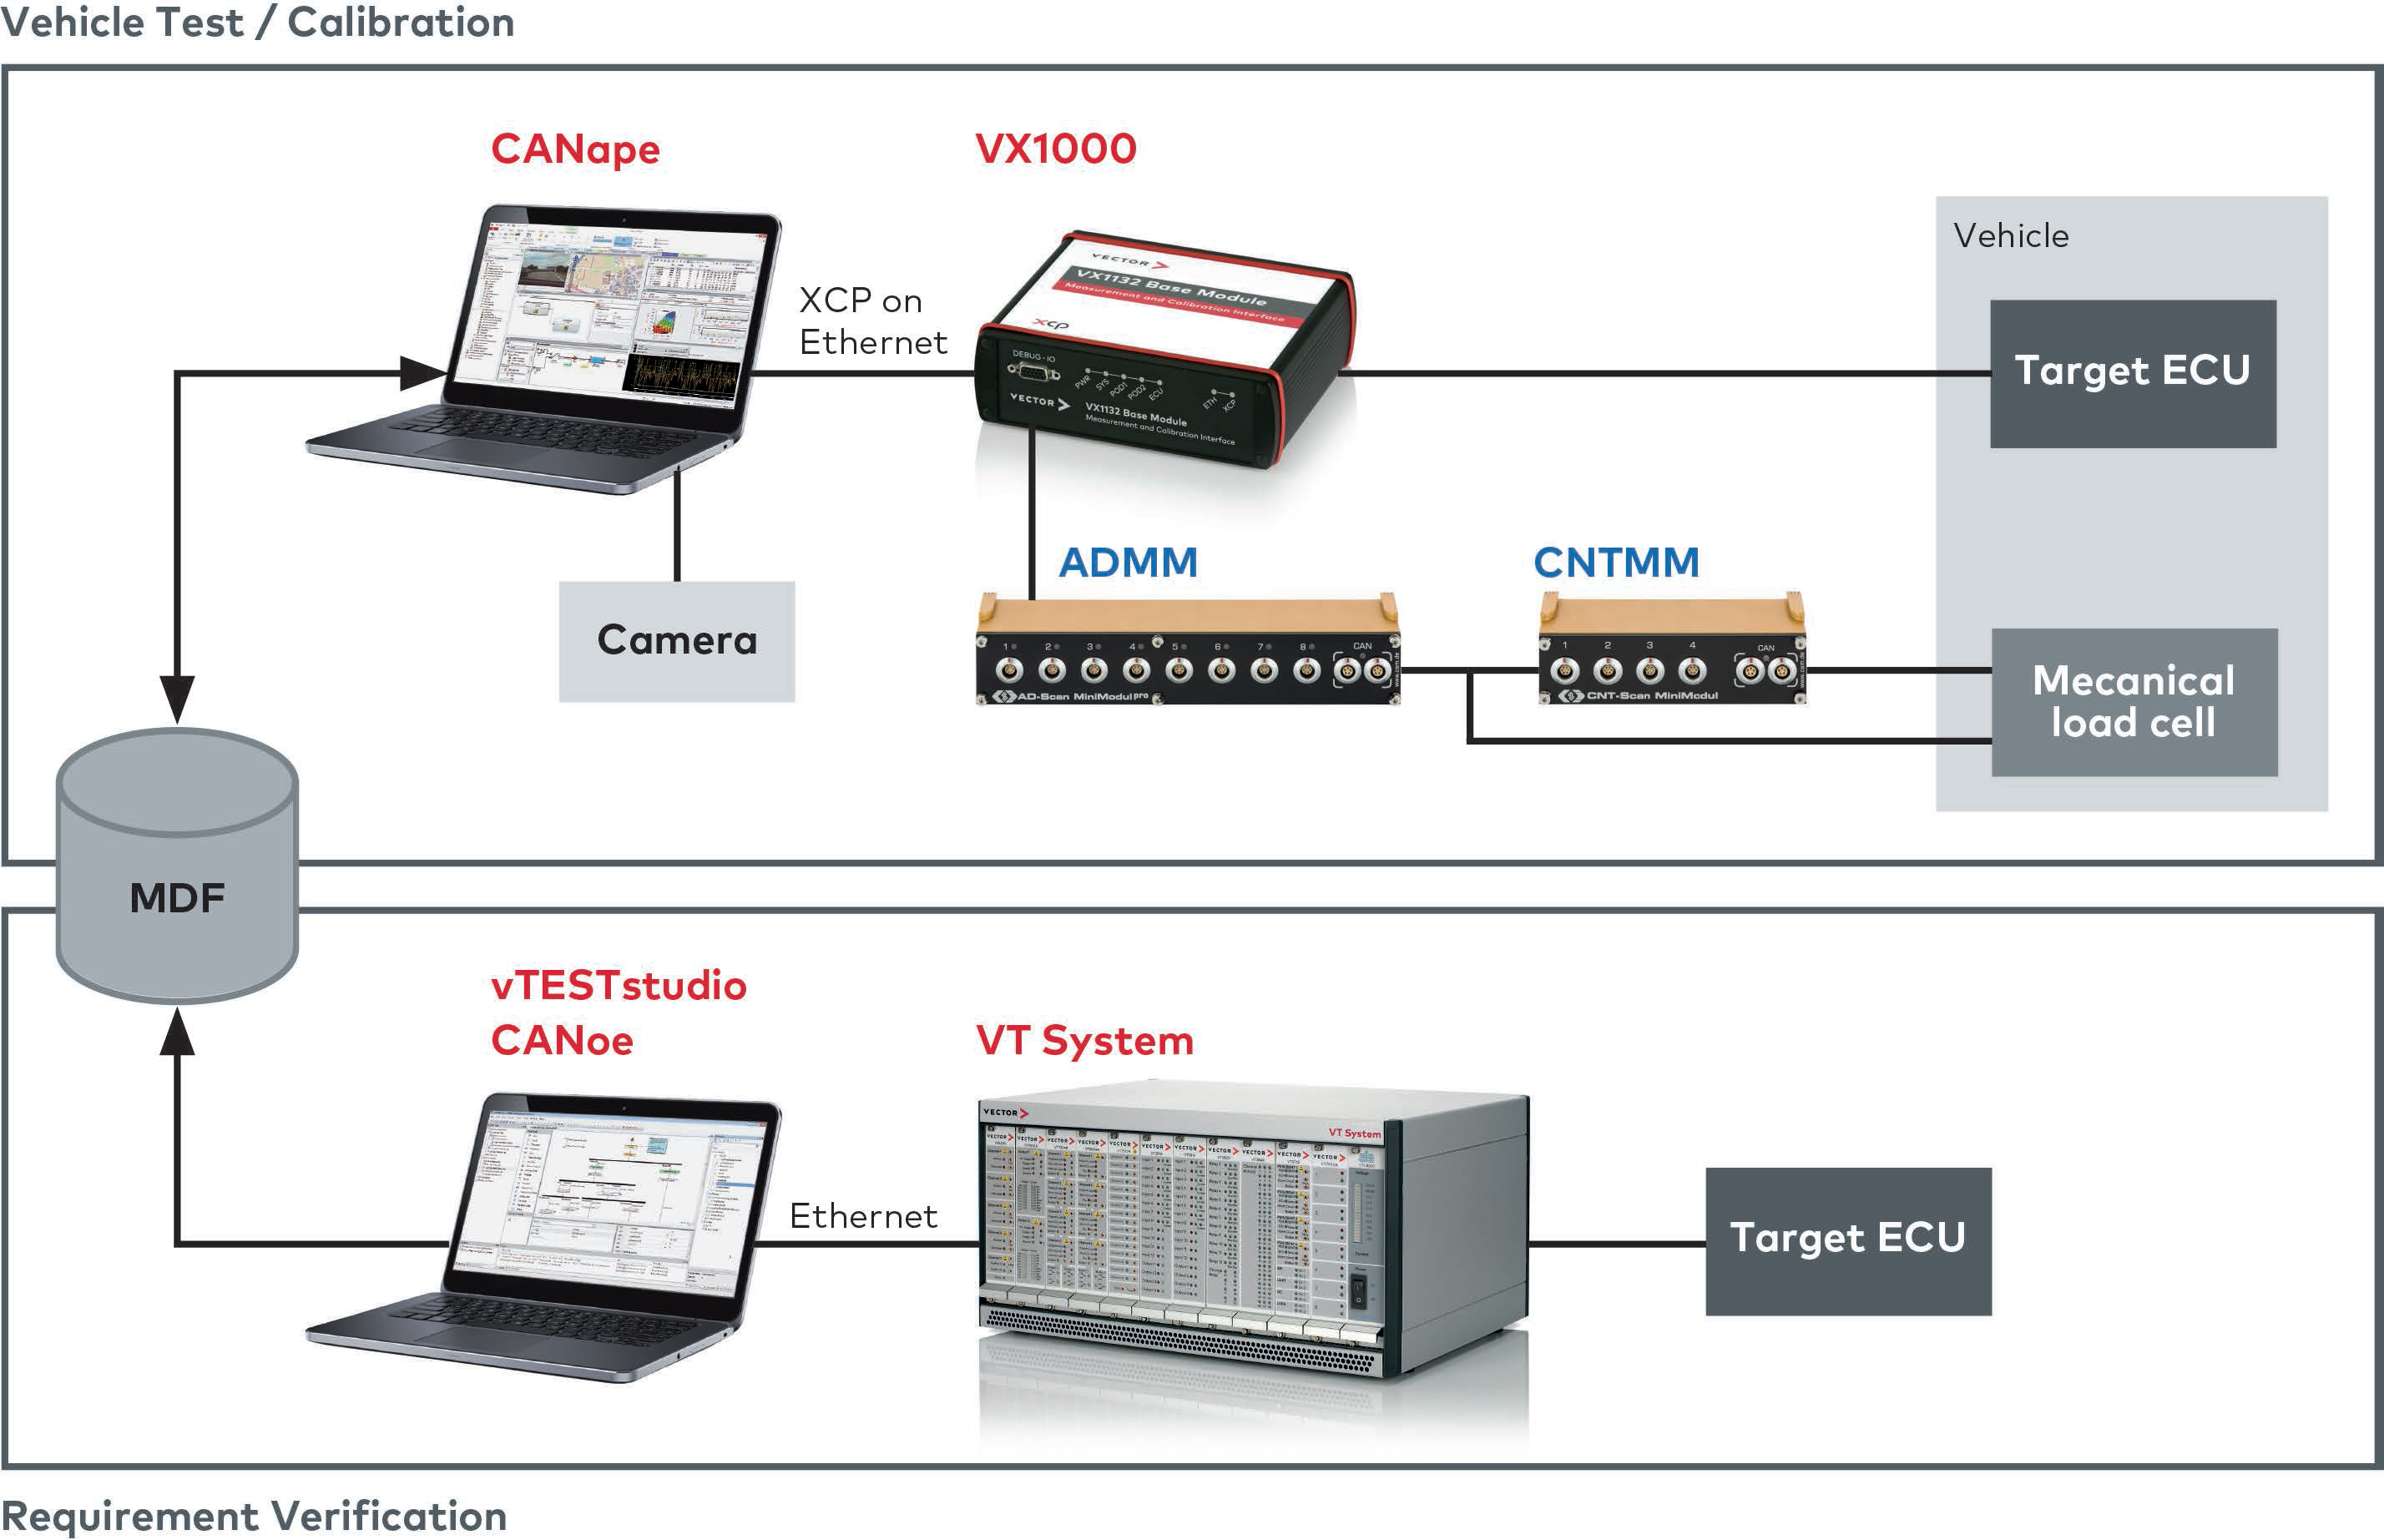 Figure 2: The test and measurement system used by ATC-A consists of software and hardware modules from Vector and CSM that measure variables inside the ECU memory and physical values from the control system like voltage, current, actuator motion and more. Source: ATC-A and Vector
With the Vector tools, ATC-A’s process changed completely. All measurement and analysis tasks are handled completely within the CANape system. All test definition and execution are also handled completely within the CANoe system. Correlating data between the two systems is implicit through the open standard MDF file format common to both.
Another software tool used by ATC-A was vTESTstudio, used in conjunction with CANoe and the VT System hardware, which is a modular system of software and hardware employed to define and execute ECU functional tests. The modular nature of the system accommodates many different test cases and expansion when needed.
The previous switchbox was replaced with a CANape panel to allow similar as well as additional functionality. The CANape software can handle measurement configurations of 100,000 signals from a single device, sample rates as fast as 800 kHz (1.25 microseconds between data points) and total data streams greater than 1 GB/s when measuring multiple devices in parallel, including data from the ECU memory, measurement modules, video cameras, accelerometer and GPS.
ATC-A used various hardware for input, including the VX1000. This device is capable of measuring embedded software variables at sample rates as fast as 100 kHz (10 microseconds between data points) and total data throughput up to 100 MB/s when interfacing with the ECU microcontroller through a data trace port.
The CSM GmbH measurement equipment that ATC-A used, provided by Vector, consists of modules that measure analog and digital signals from the complete vehicle control system. The data from the CSM equipment is seamlessly integrated, time-aligned and analyzed in CANape.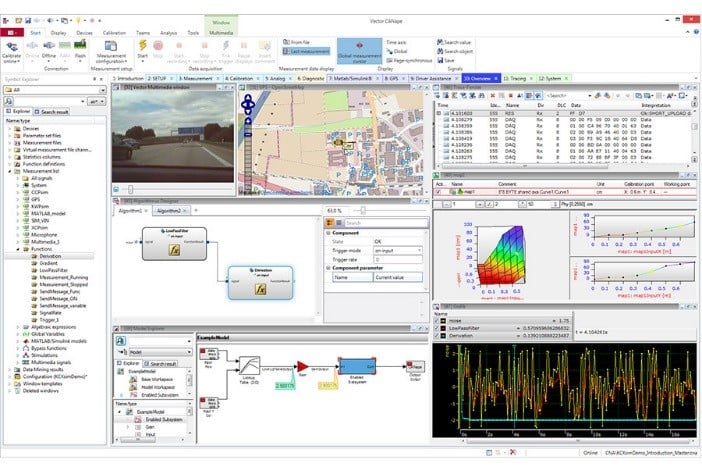 Figure 3: The data is analyzed with various charts and graphs as well as the ability to record GPS location and video data. Source: Vector
Yoshihiko Nakajima, ATC-A body planning manager, said, “ATC-A has to evaluate the ECU in a very limited time. Thus, it is very convenient that all relevant data can be measured in synchronization with the ECU RAM and external input signals directly. By the unified measurement environment, about 25% efficiency improvement (in-house ratio) has been achieved.”
The Vector tools collect many more data points and offer a view of the data as it is being collected. This new approach does two things: spots problems as they occur, adjusting the ECU on the fly; and eliminates additional testing to gather more data. This speeds up both the testing and analysis. In the case of on-road testing, it may be difficult to repeat a test so getting all the data in one sample makes finding, understanding and fixing problems essential.
Summary
While previous methods of ECU testing can be done, they present problems. It takes more time to analyze and can include questionable data accuracy. The Vector system provides an easy-to-use system that saves time and money, and significantly improves analysis and data quality.
Contact Vector for more information.