During thunderstorms, the local news will show images generated by the nearest Doppler radar site. The average viewer at home associates the red colors with more severe weather and the greener colors with lighter precipitation, and this is enough to convey the message of whether to take shelter or not.
However commonplace Doppler radar may appear, it is an incredibly useful tool for analyzing storms by both meteorologists and amateur weather geeks alike. The trick is learning how radar works and what limitations it has before jumping to conclusions about what is going on in the sky.
What is Doppler radar?
Doppler radar can be described by the two terms, Doppler, involving the Doppler Effect, and radar, which is an acronym for radio direction and ranging. For weather purposes, it was discovered almost accidentally during World War II, where early radar installations kept seeing “noise” when they were looking for enemy bombers.
Currently, Doppler radar is used for tracking precipitation and storms, and the data interpretation performed by a combination of computers and meteorologists is disseminated through media outlets for consumption by the general public.
How it works
Doppler radar is basically a transmitter and receiver of microwave radiation. A short-duration pulse is emitted from the radar dish during the transmit cycle. Then, the radar listens for the reflections. The pulses are reflected from rain, hail, debris, bugs and any number of other sources. Because the speed of the pulse transmission is known (nearly the speed of light), and the time between transmitting the pulse and receiving the reflection is known, the distance can be calculated. The longer the time delay between sending a pulse and receiving the reflection, the farther away the storm from the radar site.
To scan all of the sky, the radar dish rotates through many positions. It also steps up through a variety of azimuth angles, with typical scans ranging from 0.5° to 19.5° from the horizon. Through various algorithms, 3D models of the weather can be created.
The pulses are also polarized, meaning their reflective components can be characterized by their polarizations. This adds to the versatility of the Doppler radar system.
Speaking of versatility, there are a number of important tools that can be used by meteorologists based on the Doppler radar data. Three of the most important are reflectivity, velocity and correlation coefficient.
Reflectivity
Perhaps the most commonly available tool that Doppler radar supplies is the reflectivity images. Reflectivity is displayed in the standard red through green color scheme that is what most people imagine when they think of the word “radar.”
The reflectivity is simply the measurement of the reflected signal and the time it took to return to the dish. The stronger the reflection, the heavier the precipitation, and the more red the display on most software packages.
The two most common reflectivity images are “base level” and “composite.” Base level reflectivity shows the reflections on only the bottom scan of the radar signal, indicating the reflections that are the lowest to the ground, often where severe weather will impact humans. The composite reflectivity image looks at all scans and reports the highest reflectivity at any scan for each geographic location.
With base level images, the immediate threat is more easily identified. This image is less cluttered than a composite image that may display suspended precipitation that is not yet falling. However, the composite image does show where there may be a future threat as well by displaying suspended precipitation and other features that are not yet falling to the surface.
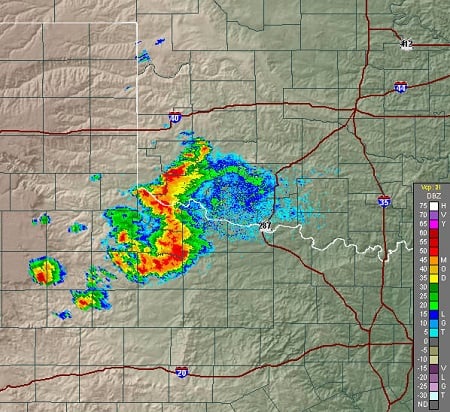 Base reflectivity (above) and composite reflectivity (below) of the same storm. Source: NWS

Velocity
The most misunderstood concept in Doppler radar is likely the velocity profiles. The “Doppler” component of radar takes account of the motion of the particles in the air, based on the Doppler Effect. Simply put, the Doppler Effect is the change in frequency of a signal due to its motion, such as how a high-speed train passing sounds higher in pitch during the approach and lower in pitch as it speeds away. The Doppler radar does the same — green pixels are particles and precipitation moving toward the radar site and red pixels are precipitation moving away from the radar site.
The main problem with this approach is that storms are moving. A fast-moving storm may show all of the precipitation moving toward the radar site. To combat this, most radar installations include an algorithm to subtract out the general motion of the storm. The result is called “storm relative velocity” and can be useful for determining rotation in the storm.
Rotation can be roughly identified by areas of red pixels (moving away from the radar site) next to green pixels (moving toward the radar site) in the storm relative velocity image. Rotation is important to identify, as it is necessary for the formation of tornadoes.
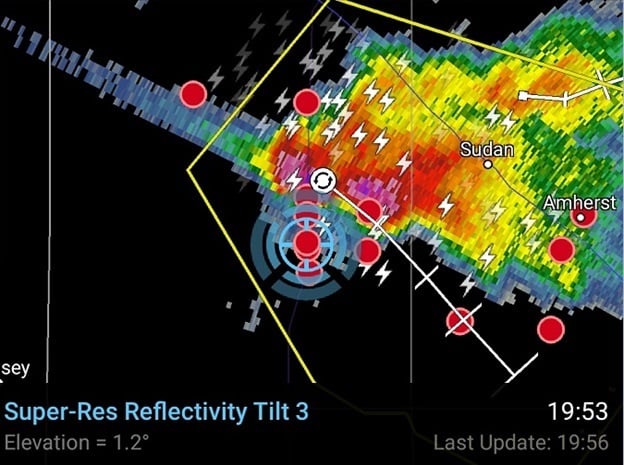
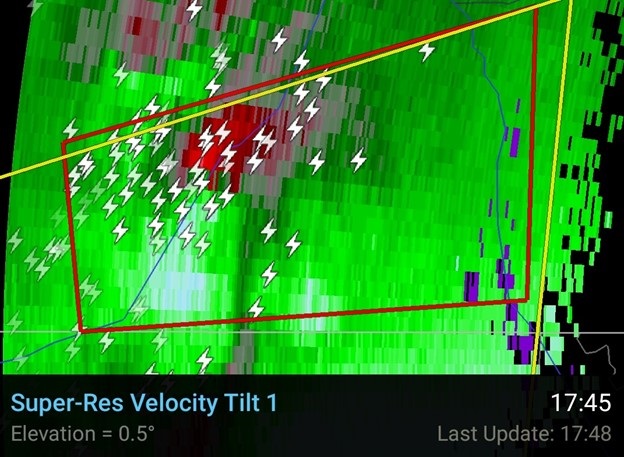 Storm-relative velocity image of a tornadic storm in Texas. This image has a red box highlighting the tornado warning, and lightning markers as well. Notice the bright red and bright green near each other in the tornado warning box. Source: RadarScope software
Correlation coefficient
Another important tool is the correlation coefficient, or CC. The CC is the ratio of the vertically polarized reflections to the horizontally polarized reflections. If the radar beam is striking roughly spherical objects,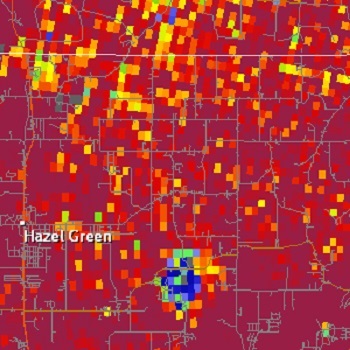 In this CC image, the blue and green pixels are where the CC is closer to zero, which could indicate debris from a tornado. Source: NWS such as raindrops or hailstones, the ratio should be nearly one, meaning horizontally and vertically polarized signals are reflected at nearly equal levels. However, if non-spherical particles are causing the reflections, the CC will be less than one.
Why does this matter? Rain and hail are spherical, but debris is not. If there is a large straight line wind event or a tornado, trees, buildings, awnings, vehicles and other debris are lofted into the air. Based on their orientation, they will reflect the signals differently. This means the CC can be used to confirm a tornado is occurring, provided other observations are in agreement. Often, a CC will reveal a “debris ball” near the tornado, where CCs are significantly less than one.
Unique signatures
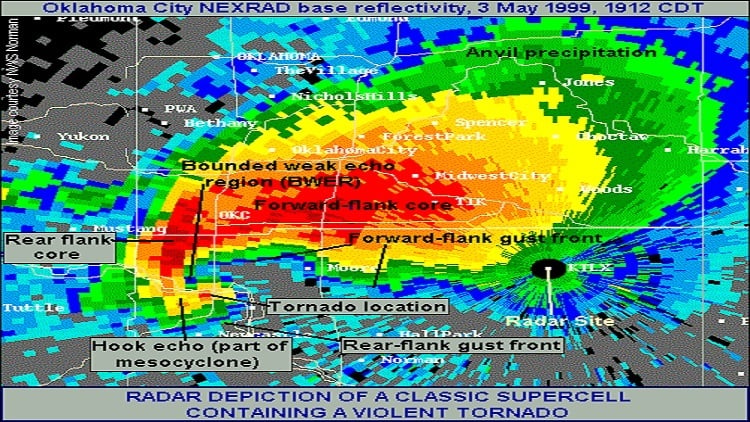
For severe weather forecasting, there are many unique radar signatures of interest. Three of the most common are the Hook Echo, “Flying V” and Three Body Scatter Spike (TBSS).
Hook Echo
Hook Echoes are signatures that indicate rotation; combined with other data, a Hook Echo can indicate a tornado is on the ground or is about to form. Often, “radar indicated” tornado warnings are issued based on the presence of a Hook Echo.
A Hook echo is evidence that a storm has begun to rotate, as the precipitation core wraps around behind the center of rotation. Typically, this rotation is counterclockwise or cyclonic (in the northern hemisphere) but not always.
“Flying V”
The severity of a storm is related to the strength and health of its updraft, meaning the rising air that forms the main cumulonimbus cloud. Severe storms have strong updrafts, with upward velocities approaching 100 mph, and these strong updrafts persist for several hours. The strong updraft will also reach heights of 50,000 ft or more.
Normally, upper-level winds are strong and largely unaffected by garden-variety summer thunderstorms. The upper-level winds are much faster and often higher than the non-severe storm’s updraft. Think of these storms like pebbles in a river, barely changing the overall flow pattern of the river. Not so with strong storms. The stronger, higher-reaching updraft is better modeled as a solid obstruction to flow aloft, causing the upper-level winds to split around it. It is more like a boulder in the river, with water diverted around it. This split-flow shows up on radar as a “V” shape, or “Flying V” where ice particles and supercooled water droplets are split around the updraft.
The presence of a Flying V signature indicates a strong updraft that will possibly lead to a severe thunderstorm. It is important to realize that the direction of the “V” is the direction of the upper-level winds, not necessarily the motion of the storm. Also, if the “V” shape doesn’t match the upper level wind direction, it is an artifact, and not necessarily a strong updraft.
Three Body Scatter Spike (TBSS)
Remember that radar interpretation treats distance as the time between the transmission and the reception. Therefore, the longer the time it takes for a signal to be received, the farther away the target (such as a raindrop) is from the radar site.
Suppose a very large target reflects the signal. It’s large enough that some of the reflection travels back to the radar site, but then some of the reflection strikes the ground…and that bit is also reflected to the radar site. The direct reflection is recorded, but the signal that bounced off the ground first takes longer to arrive back at the radar site. Because radar only understands the time difference, it treats these signals as farther away. This is called a “Three Body Scatter Spike,” or TBSS.
A TBSS is often an indication of large hail, as the hail acts as the large target that reflects signals to the ground. To identify a TBSS, there will be a spike that sticks out from the storm directly inline but away from the radar site. TBSS can be sneaky and are sometimes only visible at a particular beam height, so the meteorologist must check thoroughly for them.
 This TBSS extends northwest from the strongest part of the cell. The radar site location is southeast, just off the edge of this image captured by the author from the RadarScope app.
Limitations
While Doppler radar might seem like a magical tool for detecting all manner of severe weather, it does suffer from some limitations. This list is not exhaustive, as many other things happen to a radio signal when it is transmitted, reflected and received.
Line-of-sight
It is important to realize that the radio waves attempt to travel in a straight line. While this is not entirely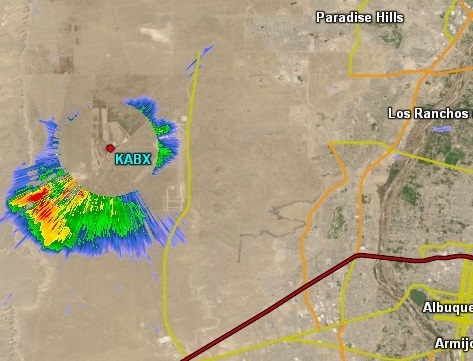 The cone of silence over the Albuquerque RADAR site nearly obscures this thunderstorm. Image taken by the author using GR Level X software. true, radio waves that travel in a straight line on a spherical planet cause a problem. The farther away the beam gets from the radar site, the higher in the atmosphere the beam. This means that a ways from the radar site, the beam cannot see what is happening in the lower atmosphere — the place where interesting weather happens.
The other problem with line-of-sight is that the radar cannot see things very close to the dish location. Typically, the highest scan may only be 20°, meaning there is a cone directly above the radar site that cannot be seen. This is called the “cone of silence.”
Interference
As a line-of-sight transmitter, the radar beam can be blocked by non-meteorological targets, such as mountains, hills, buildings, bugs, bats and other items. The U.S. National Weather Service (NWS) keeps and updates detailed Global Information Systems (GIS) records of where such targets are located and tries to filter them out.
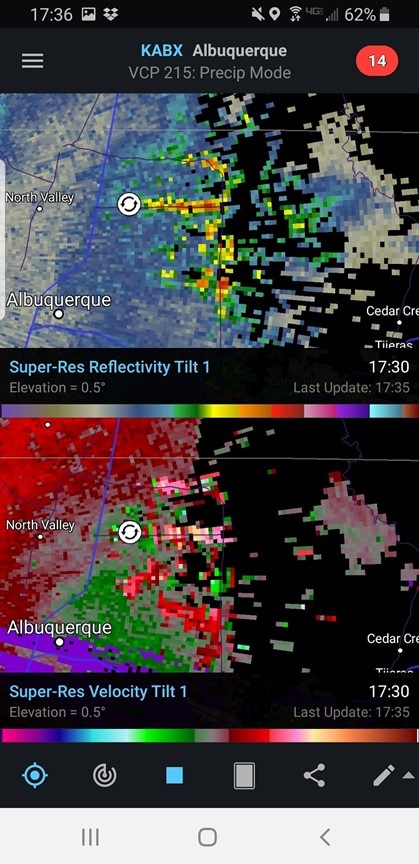 The strange lines of strong reflections are actually rush hour traffic in Albuquerque. The land slopes upward toward the Sandia Mountains, and the radar beam is measuring the cars and the disturbed air above a few major thoroughfares. The reflections were strong enough to fool a rotation detection algorithm (marked with a white circle and black arrows). The skies were clear on this day. This image was captured by the author using the RadarScope app.
Refraction
While the radio signals may attempt to travel in a straight line, sometimes they get refracted. When a child pushes a stick in a pond, the stick appears to bend. This is because the light travels differently in the water than in the air. The same thing happens to any signal on the electromagnetic spectrum, including the radio signals from the radar site.
In the example with the child and the pond, one of the key components in refraction is the density difference between the water and air. The density of air in different layers of the atmosphere, plus the density differences between hot and cold air, dry and humid air and other factors cause the transmitted signal and reflected signal to bend.
This effect is most pronounced when a strong front causes signals to be trapped, or “ducted,” to another place. In this case, the reflection may not be from where the radar was pointed. They can appear as “ghost” pixels, where there appears to be reflections, but there are no actual radar targets in that location.
Range folding
Remember that the radar sends and receives — it has no way to know how the signal traveled or what its path was during its flight. This can lead to an interesting problem called “range folding,” which is basically the opposite of TBSS.
Suppose the radar sends a pulse, listens, receives no signal, moves, then pulses again. Suddenly, a reflection is heard. The radar has no way to know whether that reflection was from the most recent pulse or the pulse before. It interprets it as from the most recent pulse, which may or may not be correct.
Range folding is where a signal takes too long to reflect back to the radar site and is misinterpreted as a closer reflection on a different pulse. This will appear as storms much closer to the radar site, even when there are no storms in the vicinity. This is particularly common when there are storms at the very edge of the radar’s range.
[Discover more about weather radar systems and equipment suppliers on GlobalSpec.com]
Final thoughts
Interpreting radar images is as much art as it is science. Most of the radar images shown online or local television stations are the result of post-processing, where some of these problems have been filtered out using various algorithms and GIS data.
The need for alternate sources of data, such as satellite images, surface observations, trained Skywarn Spotters, pilot observations and others are essential to verifying radar data.